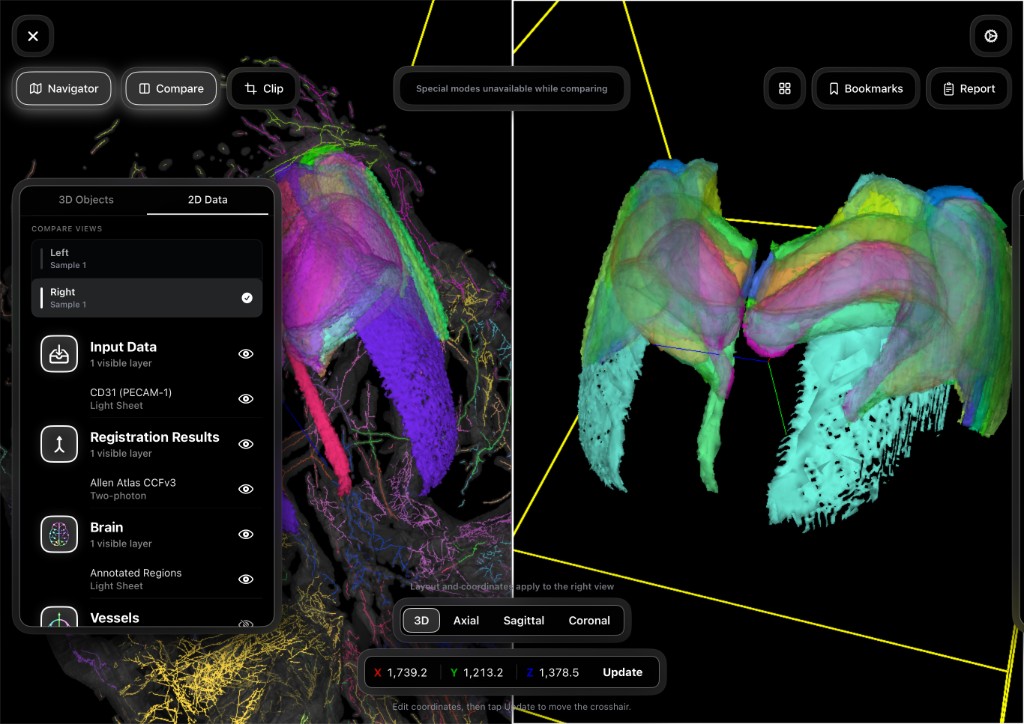
Cohort comparison · Sample space

How do preclinical labs run automated quantitative side-by-side cohort comparison?

Preclinical studies rarely rest on a single specimen. Labs need to compare vehicle versus drug, mutant versus control, or dose arms across a full cohort — with regional metrics that reproduce across operators and sites, and with visual side-by-side review that stays anatomically aligned.

What researchers typically do

Typical cohort workflows start with visual inspection and alignment. Specimens are opened in separate viewers or registered with manual or semi-automated one-off pipelines so treatment and control groups can be compared side by side. Regional volumes or densities are then exported into Excel, GraphPad, or R for group tests. Operator-dependent tracing and ad hoc alignment make it hard to defend quantitative differences in multi-site studies, CRO packages, or regulated programs.

Aligned cohorts, automated quantitative comparison

With the NeuroSimplicity Imaging Suite, you load multiple samples of the same modality into one shared native sample-space framework. The platform automatically generates population atlases for the cohort, applies atlas labels and feature extraction consistently, and calculates quantitative metrics you can compare between groups — for example treatment versus control or genotype arms. Side-by-side cohort views keep specimens anatomically aligned so visual inspection and quantitative readouts refer to the same framework. Deterministic, auditable pipelines support reproducible comparison across operators and sites. Atlas registration to the sample (Allen Atlas CCFv3 and other references) underpins regional metrics; see the atlas registration guide for alignment detail. When labs license the full Imaging Suite, the same cohort framework extends across micro-CT, light-sheet, digital pathology, and spatial omics from the study.

What the platform enables

  • Side-by-side cohort views with specimens aligned in a shared native sample-space framework
  • Automatic population atlas generation when multiple samples of the same modality are loaded
  • Automated quantitative comparison across treatment, genotype, and dosing groups
  • Consistent feature extraction, labeling, and regional metrics across the cohort
  • Deterministic, auditable pipelines for multi-site and multi-operator studies

More detail

Side-by-side cohort comparison in native sample space — NeuroSimplicity Imaging Suite

Population atlases and between-group metrics build on atlas registration to native sample space. For how that alignment works, see the atlas registration guide.

For disease-model study design that depends on cohort-scale regional volumetry across treatment arms, see the neurodegenerative disease models guide linked in Next steps.

For per-modality processing that feeds cohort pipelines, see the micro-CT and light-sheet analysis guides.

Next steps

Automated Quantitative Cohort Comparison | NeuroSimplicity